[root]#smartctl -a /dev/sda
smartctl version 5.32 Copyright (C) 2002-4 Bruce Allen
Home page is http://smartmontools.sourceforge.net/
Device: SEAGATE ST336607LW Version: 0007
Serial number: 3JA7Z7Y70000744978NE
Device type: disk
Transport protocol: Parallel SCSI (SPI-4)
Local Time is: Mon Aug 2 20:08:07 2004 JST
Device supports SMART and is Enabled
Temperature Warning Enabled
SMART Health Status: OK
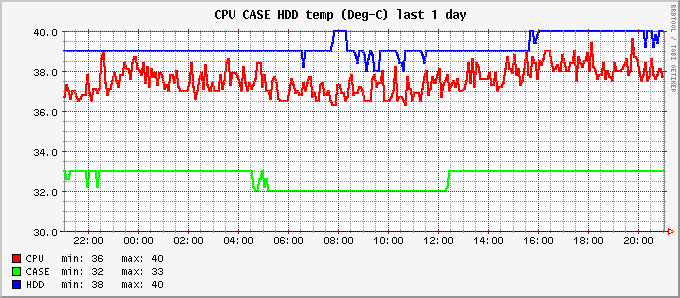
Current Drive Temperature: 34 C
Drive Trip Temperature: 68 C
Vendor (Seagate) cache information
Blocks sent to initiator = 2318344
Blocks received from initiator = 93959808
Blocks read from cache and sent to initiator = 1090338
Number of read and write commands whose size <= segment size = 3275813
Number of read and write commands whose size > segment size = 68112
Vendor (Seagate) factory information
number of hours powered up = 48.83
number of minutes until next internal SMART test = 110
Error counter log:
Errors Corrected Total Total Correction Gigabytes Total
delay: [rereads/ errors algorithm processed uncorrected
minor | major rewrites] corrected invocations [10^9 bytes] errors
read: 2103 0 0 2103 2103 7.169 0
write: 0 0 0 0 0 31.110 0
Non-medium error count: 0
[GLTSD (Global Logging Target Save Disable) set. Enable Save with '-S on']
SMART Self-test log
Num Test Status segment LifeTime LBA_first_err [SK ASC ASQ]
Description number (hours)
# 1 Background short Completed - 0 - [- - -]
# 2 Background short Completed - 0 - [- - -]
Long (extended) Self Test duration: 768 seconds [12.8 minutes]
|